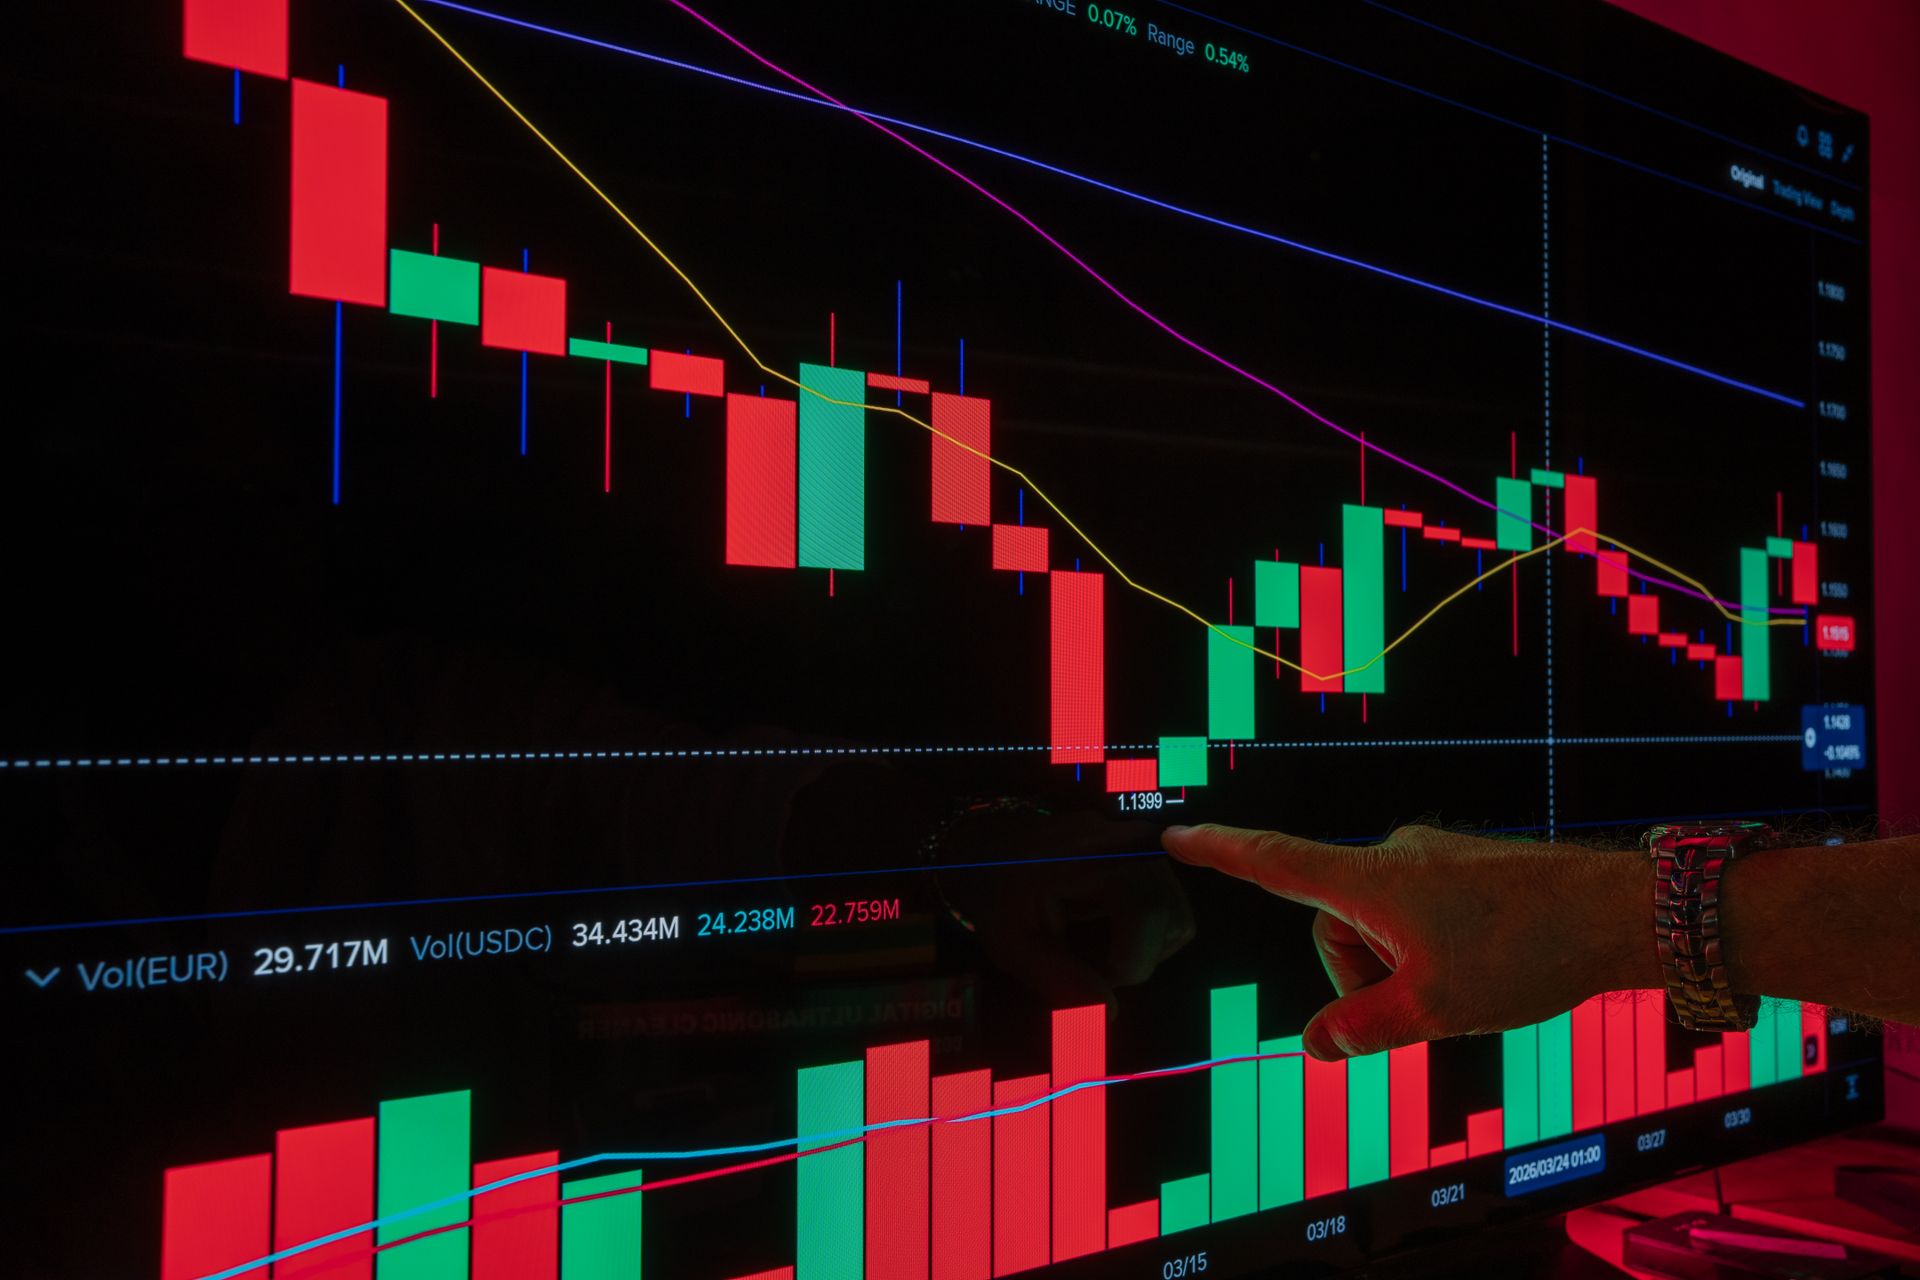
Two prints landed on the same afternoon and they cannot both be right. $520 million walked out of US spot crypto ETFs on Sept 16. On that same day, wallets holding between 10,000 and 100,000 ETH bought roughly 200,000 ETH. One side of this market is leaving. The other is buying size into the exit.
That is the entire setup. The ETF complex is a rent-a-coin wrapper that US desks rotate in and out of on a schedule. The wallets that moved 200,000 ETH are not on a schedule. And sitting right between them is a single price level that has nothing to do with either flow: $76,700.
The Tape: A Hiking Fed and a Market That Shrugged
On Sept 16 the FOMC raised the federal funds target range 25 basis points to 3.75%–4.00%. Unanimous. The first hike since July 2023, and the second of Chair Kevin Warsh’s tenure. The dot plot’s median end-2026 rate moved to 4.1%, which leaves room for one more move before the year is out.
Here is the part that should bother anyone who traded 2022. Bitcoin did not break. It is trading $75,600–$76,264 this morning, having been rejected cleanly from $78,000. Ether is $2,440–$2,461 after dipping to $2,372 and reclaiming $2,400 — a round trip, not a breakdown. XRP sits at $1.31–$1.39. SOL at $100.88. A 25bp hike into an energy-shock inflation print, and the majors are flat to higher on the day after.
The 2022 playbook — hike, then watch everything long-duration get dismantled — is not running. This is a market that priced the hike, absorbed it, and moved on to the question of where the buyers are.
$520 Million Out the Door
The Sept 16 ETF tape was ugly, and the issuer-level detail is what matters:
| Product | Flow | Issuer detail |
|---|---|---|
| US spot BTC ETFs | −$296M | IBIT −$144.1M |
| US spot ETH ETFs | −$224M | ETHA −$110.03M, FETH −$55.58M, ETHB −$19.76M |
| Combined | ≈ −$520M | Two complexes, one direction |
A half-billion dollars of paper supply, in a single US session, one day after a hawkish consensus hike. And Ether still closed up 1.54% on the day it bled $224 million.
Hold that contradiction. It is not a data error. It is the single most useful thing on the screen this week, and we are coming back to it.
Meanwhile, 200,000 ETH Went the Other Direction
Now the on-chain side, which is where the actual information is.
- More than 152,000 ETH of net exchange outflows hit the tape on Tuesday — the largest single-day withdrawal since June.
- Over five days, roughly 159,000 ETH left exchange balances entirely.
- Whale wallets in the 10,000–100,000 ETH band accumulated about 200,000 ETH over the past month, per CryptoQuant.
Coins leaving exchanges are coins moving to self-custody. That is not a trade. That is a position being taken off the board. And look at what happened to leverage while it happened: ETH liquidations of $221M on Tuesday, 88% longs — a long flush. Then, over the following 24 hours, $87.6M more, this time led by $45.4M of shorts. Open interest sits near 13M ETH, and funding rates have flipped back to positive.
Read the sequence: longs got washed out, then shorts got squeezed, and the whole time coins were being pulled off exchanges. Price dipped to $2,372 and took $2,400 back. That is accumulation showing up on the chart as a shakeout.
🚀 Ready to Start?
The world's largest crypto exchange 👋 Sign up on Binance with code HERMESS and get fee discounts!
⚠️ This content is for informational purposes only, not financial advice. Crypto investing involves risk. Always do your own research (DYOR).
$76,700 Is the Line
Bitcoin is coiled under a three-layer ceiling and sitting on a floor that is quantifiable. Line them up:
- 200-day SMA: ~$77,223 — the trend line that decides whether this is a bull-market pause or something worse.
- On-chain True Market Mean: $76,700 — the average cost basis of every coin that has actually moved. When price is above it, the average holder is in profit and supply stays quiet. Below it, the average holder is underwater and every bounce becomes a seller.
- Support cluster: $71,500–$73,500, with a liquidation cluster loading at $74,875.
Ether’s map mirrors it: 20-day EMA at $2,431 is the first thing it has to hold, then $2,544 and $2,626 as resistance, with the 50-day and 200-day EMA cluster stacked at $2,270–$2,266 as the structural floor. RSI is 53 — dead center. No one is oversold, no one is overbought, and nothing is extended.
So the trade is not complicated, it is just unforgiving. Hold $76,700 on Bitcoin and the whale accumulation was well timed. Lose it on a daily close and the $71,500–$73,500 cluster is the next real bid, with a liquidation pocket sitting right above it at $74,875 waiting to accelerate the move down.
The US Read: What Actually Changed for a US Account
Regulation moved from Congress to the agencies, and the clock is now a comment deadline. The CLARITY Act failed a Senate cloture vote 49–50 on Sept 16 — sixty were needed, so the market-structure bill is dead on this floor. It does not follow that US crypto regulation froze. It means the SEC and CFTC write it themselves. The live item is the SEC’s “Regulation Crypto Assets” proposal, File No. S7-2026-27, whose public comment deadline is Oct 20, 2026. Its draft terms include a $5M / 4-year startup exemption, a $75M / 12-month fundraising exemption, an investment-contract safe harbor, and preemption of some state registration. For a US reader, filing a comment on S7-2026-27 before Oct 20 is the highest-leverage thirty minutes available this quarter — agency rulemaking moves faster than legislation but is also easier for a future administration to unwind, which is exactly why the statutory lane was worth having. Separately, the IRS treatment did not change at all: BTC and ETH held directly are property, taxable only on disposal, with no annual mark-to-market; held inside an ETF, you own a fund share and get your brokerage’s Form 1099-B instead. Spot sales through US brokers arrive on Form 1099-DA, reconciled on Form 8949 and Schedule D. And crypto still has no wash-sale rule — you can sell a loser and rebuy the same day and keep the deduction, which is not true of the ETF wrapper. Holding the ETF buys convenience and costs you that option, plus the expense ratio.
Why ETF redemptions and spot price diverge on the same tape. SoSoValue and issuer-level data record creations and redemptions, not selling pressure. IBIT, ETHA, FETH and ETHB redemptions on Sept 16 are authorized participants closing an arbitrage — often a cash-and-carry basis trade unwinding into a rate decision — and redemptions can settle in kind, meaning the coins move between balance sheets instead of hitting the order book. Spot, meanwhile, prices on global books 24/7 against a US-session flow snapshot. That is how ETH gained 1.54% on a day its ETFs gave back $224M. The ETF number is a plumbing metric. The on-chain netflow is positioning. They answer different questions.
The 10-year near 5% is doing real work. Bitcoin throws off no cash flow, so its price is a function of the discount rate applied to future liquidity. When the risk-free rate is near 5%, the bar for holding a non-yielding asset rises and the “digital gold” bid has to compete with a Treasury bill that pays you to wait. Every basis point of yield here is a headwind on valuation and a tailwind on ETF redemptions — the mechanism connecting the FOMC to the flow tape.
And the dollar rails are being rebuilt on US terms. USDC is the compliant dollar leg most US desks already settle in, with OCC final stablecoin rules expected in November and the GENIUS Act taking effect January 2027. When the rail is regulated, the flow is durable.
🔥 Also on Bybit
Bybit is a top-3 global exchange. Sign up with code 7LMZ0G for trading fee discounts!
Sign Up on Bybit →⚠️ Crypto investing involves risk. Always do your own research (DYOR).
What Flips This
The bull case is not sentiment. It is arithmetic: $520M of ETF paper supply met 200,000 ETH of whale demand and Ether still closed green. Coins left exchanges for five straight days. Funding reset to neutral and then positive. Nothing in the majors is overbought or oversold.
The bear case is a single close. Bitcoin’s 200-day SMA at $77,223 and the True Market Mean at $76,700 are stacked directly overhead. Lose $76,700 on a daily close and the $74,875 liquidation pocket becomes the path of least resistance into the $71,500–$73,500 cluster.
That is the whole board. Two flows, one line, and a Fed that already made its move.
🚀 Ready to Start?
The world's largest crypto exchange 👋 Sign up on Binance with code HERMESS and get fee discounts!
⚠️ This content is for informational purposes only, not financial advice. Crypto investing involves risk. Always do your own research (DYOR).
🔥 Also on Bybit
Bybit is a top-3 global exchange. Sign up with code 7LMZ0G for trading fee discounts!
Sign Up on Bybit →⚠️ Crypto investing involves risk. Always do your own research (DYOR).